
Based on Jeffrey Williamson, Trade and Poverty: When the Third World Fell Behind (MIT Press, 2013)
W. Arthur Lewis argued (here) that the the world economy became highly integrated between 1870 and 1913. Trade rose dramatically, with some countries specializing in the production of industrial goods and others in the production of primary goods. The industrial economies expanded dramatically, but so did the primary producers, to keep pace with the accelerating demand for their goods. The growth of the primary producers required massive in-migration of labour, and this migration led to a second division of the world. The temperate countries drew settlers primarily from Europe, and had to offer them a standard of living comparable to the one that they left behind. The tropical countries relied on indentured labour from China and India, which could be had very cheaply. The difference in the cost of expanding production in temperate and tropical countries meant that their goods commanded sharply different prices on world markets. As Lewis put it,
If tea had been a temperate instead of a tropical crop, its price would have been perhaps four times as high as it was. And if wool had been a tropical instead of a temperate crop, it could have been had for perhaps one-fourth of the ruling price.1
The consequence of this price structure was that the temperate countries prospered under export-led growth and the tropical countries did not. The late nineteenth century, Lewis argued, saw the division of the world into industrial and nonindustrial countries, and also into rich and poor ones.
It is an interesting and compelling story, but more recent research — Lewis was writing in 1978 — suggests that the late nineteenth century was simply the culmination of a century-long process. Jeffrey Williamson, who has been a major contributor to this research, argues for a broader and more nuanced understanding of the world’s economic integration.
Rich and Poor Countries
When and why did the per capita incomes of the various countries diverge? The graph below, which uses data from Williamson’s Tables 1.2 and 1.3 (originally assembled by Angus Maddison), addresses the “when” question. Each data point in the graph is the ratio of a region’s per capita income to Western Europe’s per capita income, for one of four years: 1700, 1820, 1870 or 1913. Time is measured along a linear horizontal scale, and the ratio is measured along a logarithmic vertical scale. This graph has a handy property: the rate of change of the ratio is proportional to the slope of the curve. If the curve is upward sloping, a steeper slope implies a greater rate of growth; and if the curve is downward sloping, a steeper slope implies a greater rate of decline.

There were already considerable differences in per capita incomes in 1700. Per capita income in the European periphery was only 63% of what it was in Western Europe, and in South Asia (essentially India), it was only 53%. It is unlikely that these gaps emerged quickly, because nothing happened quickly in the seventeenth century unless it involved gunpowder. Instead, the gaps are likely to have opened up because Western Europe grew just a little bit faster than the other regions over an extended period of time.2
All of the regions fell farther behind Western Europe over the following two centuries. Latin America’s decline was intermittent. For the rest of the regions, the decline was unbroken. Their decline was slow over the period 1700-1820, which encompasses the First Industrial Revolution. Long-distance trade was still quite small at this time, and the linkages between the industrial core and the rest of the world were still weak. Their decline was more rapid over the period 1820-1913, and by 1913, the per capita incomes of East Asia and South Asia were only 18% of Western Europe’s per capita income.

Long-distance trade grew dramatically over the period of more rapid decline. The cargo capacity of the world’s shipping fleet, shown in the graph above, is a good proxy for the volume of this trade.3 Sailing ships and steamships are shown separately. There is also a total measured in “sail equivalent” that recognizes that steamships were much more effective than sailing ships, being less reliant on favourable wind and weather. (Sailing ships were always listed as “bound towards” their destinations rather than “bound to” them, in deference to the contingent nature of their voyages.) This graph is also log-linear so, once again, changes in the growth rate can be inferred from changes in slope. The growth rate of total capacity is remarkably steady from 1570 to 1820 and again from 1820 to 1913, but it is substantially higher during the latter period. The annual growth rate is just 1% over the period 1780-1820, but it is 3.7% over the period 1820-1913. Lewis emphasized the integration of the world economy over the period 1870-1913, while Williamson argues that it occurred over a much longer period. The shipping data supports Williamson’s position.

The observation that the Third World — the term now becomes meaningful — fell farther and farther behind Western Europe does not imply that it was in decline. The graph below shows regional growth rates.4 Income per capita grew very slowly before 1820, but it grew a little faster in Western Europe than it did in most other regions, causing those regions to slowly fall behind.5 All of the growth rates rose after 1820, but the growth rate of Western Europe rose significantly more than the growth rates of the other regions, accelerating their relative decline. The poor periphery did not collapse; it simply failed to keep pace with the growth leaders.
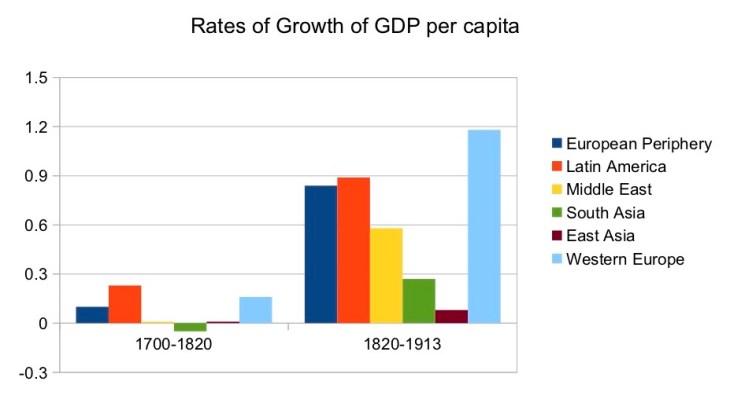
The industrialization precipitated by the First and Second Industrial Revolutions explains the increase in Western Europe’s growth rate. There was little industrialization in the other regions — there was even de-industrialization — so the same factor does not explain the increase in their growth rates. Their growth rates were drawn upwards by their strengthening trade ties with the industrial economies.
Trade Linkages
How did trade generate per capita income growth in the Third World? There were two channels. The first was improvement in their terms of trade. The second was specialization.
The Terms of Trade
A country’s terms of trade are the weighted average of the prices of its exports divided by the weighted average of the prices of its imports. An increase in the terms of trade means that the country is able to purchase more foreign goods with each unit of domestic goods that it sells abroad. Its income per capita is higher because the country’s exports are more valuable than they were before.
A one-time increase in the terms of trade generates only a one-time increase in per capita income, but if the terms of trade increase year after year, per capita income increases year after year. Consider, for example, a country whose terms of trade grow at 1% per year and which exports 10% of its production. The value of its exports rises by 1% each year. These exports constitute 10% of its production, so the value of its production rises by 0.1% each year. In other words, 1% annual growth in the terms of trade translates into an extra 0.1% annual growth in GDP and in GDP per capita. This amount might not appear very significant, but look again at the last graph. South Asia’s growth rate over the period 1820-1913 was less than 0.3%. If the terms of trade effect accounted for 0.1% of that growth, it raised South Asia’s growth rate by more than 50%. Latin America’s growth rate over the same period was 0.9%. If the terms of trade effect accounted for 0.1% of that growth, it raised Latin America’s growth rate by 12.5%.
Specialization
Adam Smith explained the benefit of trade in this way:
It is the maxim of every prudent master of a family never to attempt to make at home what it will cost him more to make than to buy. The taylor does not attempt to make his own shoes, but buys them of the shoemaker. The shoemaker does not attempt to make his own clothes, but employs a taylor. The farmer attempts to make neither the one nor the other, but employs those different artificers…What is prudence in the conduct of every private family can scarce be folly in that of a great kingdom. If a foreign country can supply us with a commodity cheaper than we ourselves can make it, better buy it of them with some part of the produce of our own industry employed in a way in which we have some advantage.6
A country should make the goods that it can produce more cheaply than it can buy them, and then trade for the goods that it can buy more cheaply than it can make them. This strategy obviously involves specialization in production. The country makes more of some goods than it needs in order to sell the surplus abroad, and it makes less of other goods than it needs, remedying the shortfall by buying them abroad.
Which goods will a country ultimately export, and which goods will it import? Writing in 1817, David Ricardo defined the concept of “comparative advantage” and explained that countries specialize in the goods in which they have a comparative advantage. His explanation made clear that specialization increases the total amount of goods available. Trade does not benefit one participant at the expense of another: it benefits all of the participants.

Smith and Ricardo were not writing for merchants and manufacturers, who had no need of instruction. Their search for profits determined which goods were produced at home and which were not, which goods were sold abroad and which brought in from abroad. Specialization is just another instance of Smith’s invisible hand at work. Smith and Ricardo had two aims. The first was to understand the workings of the economy, and more specifically, the pattern of trade. The second was to persuade governments that trade is beneficial, and should not be hampered by tariffs and quotas.
Specialization occurs in two ways. One way is the shift of factors of production out of sectors that do not have a comparative advantage and into sectors that do have a comparative advantage. In India, for example, the growth of British textile manufacturing resulted in a decline in Indian cloth production and an increase in India’s production of raw cotton. This adjustment was largely accomplished by a reallocation of labour. The other way — which produces a bigger increase in domestic output — is the expansion of sectors that have a comparative advantage by adding factors of production. Lewis emphasized the huge migrations of labour that occurred to facilitate the production of primary goods in both temperate and tropical countries, but capital also moved across borders. Railroads and other infrastructure were built with loans from European banks, and plantations were often developed with European financing.
Specialization, however it occurs, causes a one-time increase in per capita income; but if the country’s terms of trade are trending upwards, it also increases the growth rate of per capita income. Recall that 1% annual growth of the terms of trade adds 0.1% to the growth rate of per capita income when exports are 10% of production. Specialization causes exports to rise. If they were to rise to, say, 20% of total production, the increase in the growth rate would be 0.2% rather than 0.1%.
Third World countries shared in the success of the industrializing countries through trade linkages and through a small number of broadly useful inventions, such as the railroad and the telegraph. However, their non-trade sectors were largely untouched by technical progress, so they benefited from the success of the industrializing countries but could not match it.
What Actually Happened to the Terms of Trade?
The First Industrial Revolution had little impact on the terms of trade of the poor periphery7 because the volume of trade was too small to significantly alter local prices. However, the situation changed at the beginning of the nineteenth century, as shown by the figure below (Williamson’s Figure 3.2).

The periphery’s terms of trade rose dramatically between 1796 and 1856, and the United Kingdom’s terms of trade fell equally dramatically. Both trends have the same cause: industrialization was gaining momentum, particularly in Britain, driving down both costs and prices. Declining export prices drove down Britain’s terms of trade. The periphery’s imports were, to a large extent, Britain’s exports, so the periphery’s terms of trade moved in the opposite direction, doubling over the first quarter of the nineteenth century. Then, later in the century, they almost doubled again. This increase was driven by the accelerating demand for the periphery’s exports. Although the periphery’s terms of trade declined at the end of the century, they were still larger than they were at the start of the century, by a factor of 2.5.8
Averaged over the nineteenth century as a whole, the annual growth rate of the periphery’s terms of trade was 1.2% — enough to significantly increase the growth rate of its per capita income.
Not all areas of the poor periphery experienced this terms of trade boom. India’s terms of trade varied a great deal over the century, but ended the century almost as they began it. If India gained from trade with the industrial core, it was through the one-shot gains afforded by specialization. The other major outlier was China, which was excluded from the figure above. Its terms of trade at the end of the century were two-fifths of what they were at the beginning of the century, meaning that trade reduced the growth rate of China’s per capita income. Its major import — one that it was forced to accept through military force — was opium, and opium was expensive. Its major exports were silk and cotton textiles: their prices plummeted when the Industrial Revolution radically transformed the production of textiles. High import prices and low export prices imply low terms of trade.9
Specialization and De-industrialization
The poor periphery reacted to the opportunity to trade with the industrial core by becoming highly specialized. Here, once again, is a table showing how specialized they became:10
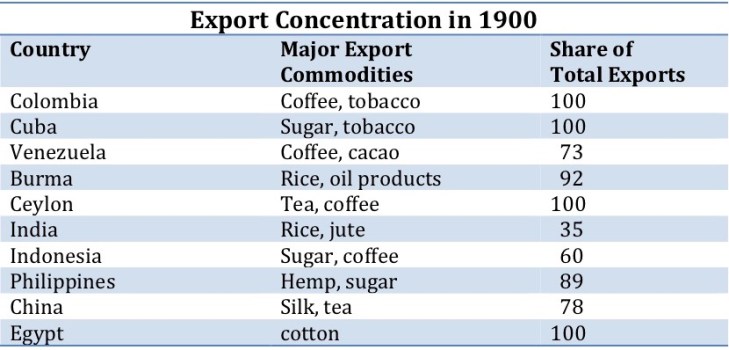
The periphery became producers of primary goods, because that was their comparative advantage. And they stopped being producers of industrial goods, because that was not their comparative advantage.
The figure below divides the world into four regions: the developed core, China, the Indian subcontinent, and the rest. Each data point shows a region’s percentage of world manufacturing output at one of five dates: 1750, 1800, 1830, 1880 and 1913.11 In 1750 the regions had roughly equal shares of world manufacturing. The core’s share of manufacturing rose somewhat during the First Industrial Revolution, and the shares of the other regions declined, but the changes are not shocking. The same cannot be said of the period 1830-1913, when the world’s economies integrated. The core’s share rose steadily until the core held a virtual hegemony over manufacturing. Manufacturing in the other regions all but disappeared.
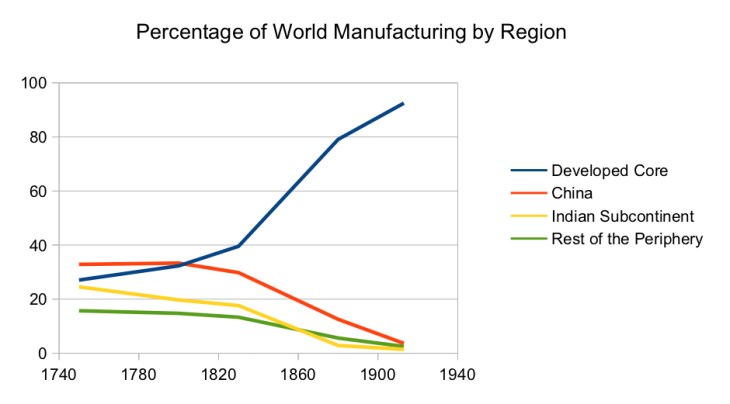
The bulk of the decline in the poor periphery’s share of manufacturing occurred before 1880. This observation bolsters Williamson’s claim that the major changes occurred before, not after, 1870.
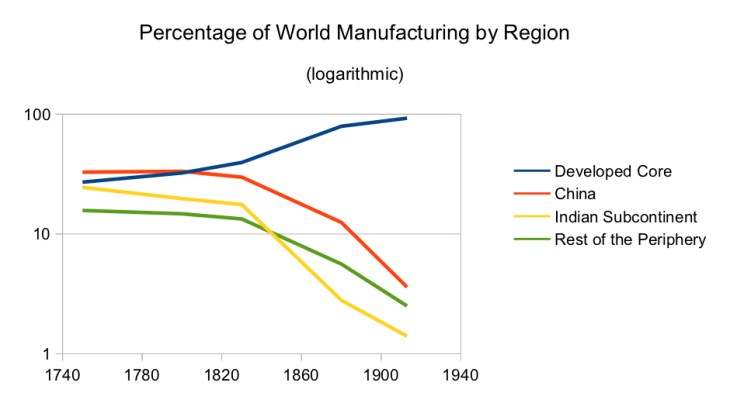
The next figure is a log-linear version of the last figure so that, once again, rates of growth are proportional to slopes. The rate of decline of a peripheral region’s share of manufacturing was either a little quicker or a little slower over the period 1880-1913 than it was over the period 1830-1880, but the significant break occurred in 1830, when long-distance trade began to grow in importance.
Further evidence for the de-industrialization of the Third World has been provided by Paul Bairoch, who calculated manufacturing output per capita for various regions.12 In 1750 there was rough parity between India, China and the Western European core. The core’s manufacturing output per capita grew by a factor of eight between 1750 and 1913. By contrast, India’s manufacturing output per capita in 1913 was just two-sevenths of what it had been in 1750, and China’s manufacturing output per capita in 1913 was three-eighths of what it had been in 1750.
Of course, the nature of manufacturing was changing at the same time as its location was shifting. The manufacturing lost by the periphery was labour-intensive cottage industry. It was replaced in the West by increasingly mechanized production, and later in the century, by factory production.
Can a Primary Producer Grow Rich?
Yes, they can, and did. Here is Paul Bairoch on this issue:
On the eve of World War I, among the eight to nine richest countries in the world, five were exporters of primary goods, and one of these five countries was then, as now, the most developed in the world: the United States. Indeed, during the nineteenth century not only were more than two-thirds of that country’s exports composed of primary goods, but a large share of these were raw materials, principally cotton. In the 1821-1860 period US raw cotton exports provided almost three-quarters of Europe’s needs.
The other rich primary goods exporters were Australia, Canada, Denmark and New Zealand. In these countries, as for the United States, not only were primary goods exported but also raw materials. After the 1850s New Zealand’s and especially Australia’s wool accounted for a large share of European imports of this fibre. In the first half of the nineteenth century Canada was an important supplier of timber to the United Kingdom. At the turn of the century, in addition to timber, Canada became a major exporter of nickel, asbestos and corundum. At that time and up to the 1920s manufactures represented less than 10% of total exports (for Australia and New Zealand this share was even smaller). Denmark concentrated on food exports and after the 1860s moved from cereals to butter, cheese and bacon. Agricultural products represented over 90% of Denmark’s exports. 13
The countries named by Bairoch are all temperate, but he is not simply echoing Lewis on the divide between temperate and tropical countries. For him, tariff policy is the crucial factor. After observing that “history does not end with World War I,” he continues:
Practically all of these primary exporting countries which are today also rich countries had already initiated an industrialization policy through protectionist measures. The only exception was New Zealand, which even today has few industries apart from those linked to agricultural exports…Such a policy reorientation was very early in the case of the United States (at independence) and rather late for Canada and Australia (last quarter of the nineteenth century). In the case of Denmark it was even later (the 1890s), and the protectionist moves were less comprehensive.
Therefore there can be no doubt that specializing in the exports of primary goods does not in itself lead to underdevelopment…However, at a certain stage, industrialization becomes an almost necessary option to achieve a higher level of development. Even if this is only marginal proof, it is worth noting that New Zealand (the least industrialized of the five countries), which was around 1880 the sixth- to eighth-richest country in the world, in 1990 declined to the eighteenth to twentieth (even excluding the rich oil-exporting countries).14
Would a “tariff wall” strategy have worked for the tropical countries? Lewis would have been sceptical of this possibility. He believed that late industrialization occurred through import substitution. The prosperity of the temperate primary producers created large domestic markets for manufactured goods. New industry, protected by a tariff wall, developed to serve the domestic market. The tropical primary producers were much less prosperous than their temperate counterparts, so their domestic markets might have remained too small to support domestic industry, even under tariff protection.
The validity of this argument hardly matters because few tropical countries were able to try the “tariff wall” experiment. British colonies were generally expected to fall in line with Britain’s free-trade position. Britain and other Western countries exerted pressure — sometimes rising to military force — on numerous countries to ensure that they adopted free-trade policies.
As for the Third World countries which were independent or not real colonies in the nineteenth century, that is, the most important parts of Latin America, China, Thailand and the Middle East as a whole, Western pressure had imposed on most of them treaties that entailed a more or less total elimination of custom duties on imports. Generally, it was the ‘5% rule’ that applied, that is, a tariff regulation under which no duty could rise above 5% of the import value of the goods.
Most of these treaties, rightly called ‘unequal treaties,’ were signed between 1810 and 1850, mainly initiated by British pressure. The political independence of almost all Latin American countries (which took place mainly between 1804 and 1822) had been largely helped by British intervention. This led to numerous trade treaties, one of the earliest of which was with Brazil in 1810. All these treaties opened those countries’ markets to British and European manufactured products…
A tariff treaty with the Ottoman Empire was signed in 1838…The Opium Wars (1839-42), which in fact aimed at making the vast Chinese territory available to British trade, ended with the Treaty of Nanking on 29 August 1842…The most comprehensive treaty with Thailand, leading to a real open economy, was signed in 1855, but this was preceded by others in 1824, 1826 and 1833. 15
Bairoch’s argument is an appealing one because it makes sense of many disparate observations, but not every appealing story is true and economic historians are still debating this one.16
And what of Bairoch’s claim that countries must ultimately industrialize to be prosperous? Williamson suggests several reasons why this might have been true in the nineteenth century. The first is that technological progress, the source of the West’s prosperity, occurred mostly in the industrial sector. Although it could not be foreseen at the time, the decision to specialize in primary production meant accepting slower technological progress and smaller productivity gains for decades. The second is that Third World countries, by focussing on the export of just one or two goods, exposed themselves to extreme price movements. When the times were good they were very good indeed, and when they were bad they were horrid. The industrial countries did not have the same exposure to price shocks because they produced a wide array of goods: a substantial fall in the price of a few goods did them little harm. The third is that in resource-rich countries, an elite was sometimes able to monopolize both political and economic power, leading to distorted decision-making. Lewis’s comparison of Argentina and Australia is apposite.
Nevertheless, there are some very wealthy primary producers in the world today, namely the oil-rich Gulf states. It is interesting to consider how they have fared with respect to Williamson’s three problems. They have been fortunate with respect to technological progress. Oil is indispensable, and extracted in huge volumes (currently, about 100 million barrels per day). Improvements in finding and extracting oil have the potential to be very profitable, and that potential has attracted generations of eminently successful innovators.
Though he was prepared to go quite a bit deeper when he turned on his steam-powered drill in Crawford County, Pennsylvania, in 1859, Colonel Edwin Drake struck oil at 69 feet. The first “deep water” oil wells stood in 100 feet of water in 1954. Today [2005], they reach through 10,000 feet of water, 20,000 feet of vertical rock, and another 30,000 feet of horizontal rock…Ten mile oil costs less than 69-feet oil did, and about the same as one-mile oil did two decades ago. Production costs in the hostile waters of the Statfjord oil fields of the North Sea are not very different from costs at the historic Spindletop fields of southeast Texas a century ago.17
Production costs are much lower in the Gulf states than in the North Sea: Saudi Arabian oil can be extracted for about $10 per barrel. These states, however, are massively exposed to price shocks. Within the last decade or so, the price of a barrel of crude oil has topped out at $140 and bottomed out at $40. The low prices of the last few years have been difficult ones. The profit margin on a barrel of oil is still substantial, but government revenue has fallen dramatically. Saudi Arabia, for example, had a budget deficit equal to 8.9% of its GDP in 2017. Finally, as for exercising hegemony over economic and political power, the House of Saud is the exemplar.
- W. Arthur Lewis, The Evolution of the International Economic Order, p. 16. ↩
- To see the cumulative impact of a small difference in growth rates, let R be the ratio of the region A’s income per capita to region B’s income per capita. The growth rate of R is equal to the difference between the growth rates of A’s and B’s incomes per capita. Now apply the “rule of 70,” which states that the number of years required for a quantity to double is, roughly, 70 divided by its annual percentage rate of growth. The ratio R doubles in about 70 years if the difference in the growth rates is one percentage point, and it doubles in about 140 years if the difference is only one-half of one percentage point. ↩
- The data are from Angus Maddison, The World Economy (OECD Publishing, 2001), p. 95. ↩
- This graph is also based on data from Williamson’s Tables 1.2 and 1.3. ↩
- Even Western Europe’s growth was very slow before 1820. The First Industrial Revolution was primarily a technical revolution, and it did not immediately result in significantly faster growth of per capita income. This issue is discussed here. ↩
- Adam Smith, The Wealth of Nations (1776), Book 4, Chapter 2. ↩
- Williamson defines the poor periphery to include six countries from Latin American (Argentina, Brazil, Chile, Cuba, Mexico, Venezuela), four from the European periphery (Italy, Portugal, Russia, Spain), three from the Middle East (Egypt, the Ottoman core, the Levant), two from South Asia (Ceylon, British India), four from Southeast Asia (Indonesia, Malaya, the Philippines, Siam), and two from East Asia (China, Japan). The choice of countries was strongly influenced by data availability. ↩
- For a modern parallel, think about the impact on an oil-rich country of an increase in the price of oil from $40 per barrel to $100 per barrel. ↩
- Most of the decline in China’s terms of trade occurred in the first quarter of the nineteenth century, as did most of the decline in the United Kingdom’s terms of trade. The cause of both declines was, in large part, the expansion and transformation of the British textile industry: textile prices fell because mechanization and economies of scale were driving down production costs. The difference between China and Britain was that Britain had both lower production costs and lower export prices, while China just had lower export prices. ↩
- The data are drawn from Williamson’s Table 4.2. ↩
- The data are taken from Williamson’s Table 5.1. He cites two sources: (1) C. Simmons, “Deindustrialization, Industrialization, and the Indian Economy,” Modern Asian Studies, 1985; (2) Paul Bairoch, “International Industrialization Levels from 1750 to 1980,” Journal of European Economic History, 1982. ↩
- Paul Bairoch, “How and Not Why: Economic Inequalities Between 1800 and 1913,” in J. Batou, ed., Between Development and Underdevelopment: the Precocious Attempts at Development of the Periphery 1800-1870 (Librairie Droz, 1991). Williamson presents these numbers of his Table 5.2. ↩
- Paul Bairoch, Economics in World History (University of Chicago Press, 1993), p. 140. ↩
- Paul Bairoch, Economics in World History (University of Chicago Press, 1993), p. 141. ↩
- Paul Bairoch, Economics in World History (University of Chicago Press, 1993), pp. 41-2. ↩
- Specifically, there is dispute among the econometricians as to whether tariffs contributed to growth in the late nineteenth century. This dispute is discussed here. ↩
- Peter Huber and Mark Mills, The Bottomless Well (Basic Books, 2005), p. 2. ↩
