
Based on Robert Gordon, The Rise and Fall of American Growth (Princeton, 2016)
W. Arthur Lewis (here) believed that 1870 was a turning point in the economic history of the world. The West implemented the technologies of the Second Industrial Revolution (here) and grew rapidly. Western firms became increasingly dependent upon Third World countries for raw materials such as cotton, wool, copper, oil, timber, and bauxite, while Western consumers wanted their sugar, tobacco, coffee and tea, beef and mutton. Many countries in the Third World responded by specializing in the production of primary goods, exchanging them for the manufactures of the West’s industrial core. This strategy accelerated their growth (here), but the Third World could not keep pace with the industrial core. The West would continue to outgrow the Third World until well into the twentieth century.
There was also a realignment within the industrial core. Great Britain had once dominated world markets, but now faced fierce competition. One of its strongest competitors, with fateful consequences for all of Europe, was Germany. Another was the United States. Its divisive and destructive Civil War behind it, the United States entered an extended period of growth that would make it the most prosperous country in the world. The Rise and Fall of American Growth is Robert Gordon’s attempt to discover the origins of America’s remarkable growth. His findings sometimes contradict popular beliefs about America’s past and about its future prospects.
The Sources of Growth
The standard of living in any country is closely linked to its per capita output, which measures the average amount of goods and services available to its citizens.1 If the standard of living is what we ultimately care about, the growth that matters is the growth of per capita output.
The first clue to the sources of this growth is found in a simple relationship:
output per person = output per hour of work × hours of work per person
The second factor, hours of work per person, is simply total hours of work divided by population. It exhibits both cyclical and secular movements. The cyclical movements are induced by the business cycle and have little impact on the long-term growth of the economy, but the secular movements are important. Hours of work per person grew in the 1960s and 1970s because the baby boomers entered the labour force, and because women began to enter the labour force in substantially greater numbers. The result was a quickening of the growth of per capita output. The boomers are now leaving the labour market through retirement. The decline in hours of work per person will slow the growth of per capita output over the next decade or so.
Changes in hours of work have had, and will continue to have, a substantial impact on the American economy, but there are two reasons why they should not be our focus. The first is that the century in which American economic growth was the strongest (1870-1970) was also a century in which the typical employee’s hours of work fell substantially. The average work week in the manufacturing sector was a little more than 60 hours in the final decades of the nineteenth century. It fell below 50 hours after World War I, and below 40 hours after World War II.2 America experienced world-beating growth during this century because the first factor — output per hour of work — was overwhelmingly more powerful than the second factor. The second reason is that if we are looking for the source of future growth, longer hours of work won’t be it. Hours of work will decline over the next decade or two as the boomers retire. Over the longer term, the trend toward shorter work weeks and longer vacations is likely to continue: as people become richer, they will want to take part of their prosperity in the form of greater leisure. Future increases in output per person will almost certainly be caused by increases in output per hour.
So, the crucial question is, what causes output per hour of work to grow? The answer is based on the aggregate production function, which describes the relationship between the goods and services produced by a country and the inputs used in their production. Here is a production function that has repeatedly been shown to explain the data:


The capital stock represents the total amount of plant and equipment in the country. There are, of course, many thousands of different kinds of plant and equipment. They are aggregated into the number
There are likewise many kinds of labour — tinker, tailor, soldier, sailor — so expressing the labour input as a single number again requires aggregation. Capital is aggregated by measuring it in dollars; labour is aggregated by measuring it in effective hours. Effective hours adjust for skill differences across workers by “grossing up” the hours of work done by skilled workers in proportion to their productivity advantage over less skilled workers. If engineers are twice as productive as mechanics, for example, each hour of an engineer’s work would be counted as two hours of a mechanic’s work. If mechanics are in turn twice as productive as unskilled labourers, each hour of a mechanic’s work would count as two hours of an unskilled labourer’s work. An hour of an unskilled labourer’s work is one effective hour of labour, an hour of a mechanic’s work is two effective hours, and an hour of an engineer’s work is four effective hours. The labour input is simply the total number of effective hours of labour provided by the workers over the course of a year.
It is useful to express total effective hours as the product of total hours, 

The production function shows the relationship between the output of goods and services and the inputs of capital and labour. Economists can construct time series for output and for both inputs. The parameter 

Now, at last, we can answer the original question: what causes output per hour to grow? I will adopt the convention that a lower-case letter represents the growth rate of the corresponding upper-case variable (for example, 

It is interpreted by applying this rule:
The growth rate of a product is the sum of the individual growth rates. The growth rate of a ratio is the difference between the individual growth rates.
The lefthand side of the equation is the growth rate of output per hour (


growth rate of output per hour = (growth rate of TFP) + b (growth rate of capital-labour ratio) + (1 – b) (growth rate of skills)
And that is quite an exact answer to the question.
Gordon has calculated the historical contributions of these three factors to American growth. His findings are summarized in the figure below.5 The “TFP” block corresponds to the first term on the righthand side of the quasi-English equation, the “capital deepening” block to the second term, and the “education” block to the third term.

Gordon finds that the data break most neatly into three periods: the middle years (1920 to 1970), the early years (1890-1920), and the late years (1970-2014). Output per hour — the cornerstone of the standard of living — grew most quickly during the middle years, at 2.82% per year, even though this period includes both the Dirty Thirties and the years during which the economy was upended by the desperate need for war materials. The growth rate during the late years, which we often imagine to be years of unceasing technological change, was a little less than 60% of the growth rate during the middle years, and little different from the growth rate during the early years.
The disconnect between our sense of technological progress and the reality of it is even more apparent in the sources of growth. The speeds of capital deepening and skill acquisition were not much different across the three periods. Most of the differences in growth rates was caused by differences in TFP growth rates: TFP growth during the middle years was almost three times as fast as TFP growth during the early and late years!
The figure below shows TFP growth rates in greater detail.6 The pace of TFP growth rose from the 1900s to the 1940s, then fell for several decades to reach a low in the 1970s, before recovering somewhat in the following decades.

Could technological progress really have been so rapid in the past? Could it really be so slow in the present? These questions must be considered separately.
Rapid Total Factor Productivity Growth Before 1970
Gordon attributes rapid TFP before 1970 to two factors: the staggered implementation of the great inventions of the late nineteenth century, and the organizational innovations precipitated by World War II and the Great Depression.
The Five Great Inventions
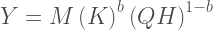
Yes, I know: you’d be lost without your cellphone. But at least you wouldn’t be walking to the outhouse on a cold winter morning, your path lit by a kerosene lantern. You wouldn’t be using one of those newfangled safety matches to light a fire in the wood stove. You wouldn’t be heating a pan of water on the stove so that you could wash your hands and face and maybe the back of your neck in water that was tolerably warm.
That’s what you would be doing if it was 1870. Our surprise at the rapid technological progress of the early twentieth century is largely a matter of not thinking about how we got from the austere world of 1870 to the more-or-less modern world of 1940. Gordon has identified five clusters of transformative inventions. Although many of these inventions had their origins in the late nineteenth century, their implementation stretched well into the twentieth century.
- Electricity The light bulb was a pivotal invention: it provided bright, safe and soot-free light. It also precipitated the construction of central power stations and power distribution networks. This infrastructure would power a stream of new appliances that vastly improved household life, such as radios, refrigerators, electric heating, hot plates, air conditioning and fans, washing machines and dryers, and vacuum cleaners. For businesses, the crucial invention was the electric motor. It made possible portable tools and movable machinery, and gave factories greater flexibility in the organization of work.
- The Internal Combustion Engine The first internal combustion engines were stationary power sources for factories and workshops. They were more compact than steam engines and could be quickly stopped and started. They eliminated the dangers of high-pressure steam, and removed the need to organize the factory around a central drive shaft. The possibility that they could power vehicles was quickly recognized, and the first automobiles appeared in 1885, less than a decade after the invention of the four-stroke engine. Their development was swift: the first Mercedes automobile, offered for sale in 1901, could travel at 85 kilometers per hour. The speed and reliability of the automobile allowed people to travel much longer distances, ending the isolation of farm life and facilitating the growth of cities. The airplane changed Americans’ sense of speed and distance to an even greater degree. The first nonstop flight across the United States occurred in 1923, and Lindbergh crossed the Atlantic in 1927.
- Chemistry The United States began to refine petroleum in 1859, when its first oil well was drilled. Refineries initially produced kerosene, which was burned for light. Electrification diminished the demand for kerosene, but the spread of the internal combustion engine increased the demand for gasoline, which became the refineries’ main output by 1920. The technology of petroleum refining developed throughout the first half of the twentieth century, and more and more uses for petroleum products were found. Today, kerosene is the base for jet fuel, while naphtha is used in plastics and in cold-climate jet fuel. Natural gas has an even longer history in the United States: it was used for lighting as early as the 1820s. Robert Bunsen, a German chemist, perfected the “Bunsen burner” in the late 1850s.7 It was designed to produce heat, not light, and it became the basis of a number of household appliances, including furnaces, hot water heaters, and stoves. Natural gas also had industrial applications, and was often used in the generation of electricity. Lack of infrastructure impeded its use until the twentieth century, when a more extensive system of natural gas pipelines was in place. Industrial chemicals began to be produced on a much larger scale around the turn of the century, and companies such as Dow Chemical and Dupont competed in world markets. Synthetic materials appeared at about the same time. Bakelite was invented by Leo Baekeland, a Belgian-American chemist, in 1907. It was electrically nonconductive, and was widely used in insulators, radios, and telephones. PVC (vinyl) was initially developed in Germany, but no commercial purpose was found for it. It was improved in the 1920s by the B. F. Goodrich Company, which first used it in golf balls and shoe heels — now it’s everywhere. Nylon was synthesized by Dupont in 1935 and first used commercially in 1938 (in a toothbrush). The pharmaceutical industry also began to develop in the early twentieth century. Bayer, the German pharmaceutical company, introduced Aspirin in 1899. Bayer developed sulfa drugs, the only effective antibiotic before the discovery of penicillin, in the 1930s. Cortisone was first used to relieve rheumatoid arthritis in the 1940s.
- Communications and Entertainment All of these innovations appeared between 1870 and 1940: telegraph, telephone, phonograph, photography, radio, motion pictures, and television. Imagine a world with none of them.
- Sanitation Indoor plumbing was available to the wealthy by the middle of the nineteenth century, but only became widely available after 1880. A large part of the delay was the time and money required to build the infrastructure. Many of the early sewage systems simply released human waste into bodies of water, which was both unhealthy and unpleasant, but by the early twentieth century the sewage of most major cities was being treated before discharge. The practice of chlorinating drinking water to prevent water-borne diseases was also developed in the early twentieth century. Running water and sewage systems spread slowly. They appeared first where populations were dense, and then spread to more sparsely populated areas. Many remote farms were still using untreated well water and outhouses in the middle of the twentieth century.
These inventions radically changed the character of human life between 1870 and 1940. Paul Krugman has suggested that a modern American transported back to 1940 would find it rustic, but would be surrounded by recognizable technology — telephones, automobiles, flush toilets, refrigerators — and would easily adjust. A modern American transported back to 1870 would be utterly appalled and completely helpless.8
The qualitative changes in life between 1870 and 1940 were not fully reflected in GDP growth — for reasons discussed below — but the qualitative changes were matched by concrete and readily measurable improvements in the standard of living. Americans built sewers and subways, worked assembly lines, drove trucks and flew airplanes. They earned and spent more money than ever before. At some time during WW II the United States became the world’s most prosperous country.

The Impact of Depression and War on Productivity
Technological progress can be embodied in machinery, but it can also be purely organizational. Adam Smith’s pin factory illustrates this possibility: the division of labour increases pin production, even when the steps required to make a pin remain unchanged. Gordon suggests that changes in the organization of production account for much of the TFP growth of the 1930s and 1940s. Further TFP growth came from two pivotal technologies, electricity and the internal combustion engine. They were a half century old, but they still had the capacity to revitalize the American economy.
American entrepreneurs were already striving for organizational efficiency in the 1920s. Retailing was one sector of the economy in which there were large efficiency gains.
The distribution system was revolutionized by the movement to chain stores and self-service stores that started around 1910 and continued during the 1920s and 1930s. The number of chain food stores quadrupled during the 1920s, achieving a major boost to productivity. But chain stores initially operated by the old-fashioned “counter and shelf” system in which the customer stood in line in each separate department and the clerk both selected the item from the shelf and received payment. It was when chain stores developed self-service, much of which happened after 1930, that the real productivity gains occurred as the customers did the walking and selecting, and the number of employees needed to run a store fell by half or more.9
The Great Depression encouraged further reorganization, as firms desperately sought ways to cut their costs.
World War II put the American economy under a different kind of stress. The war created a relentless demand for war materials, so that by 1944, 80% of production went to the military. Firms of all sorts joined the war effort:
Jewelry makers made artillery fuses, producers of lawn mowers made shrapnel shells, manufacturers of postal meters made bomb mechanisms, makers of mens’ shoes made helmet liners, manufacturers of vacuum cleaners made gas mask parts, and makers of wheelbarrows shifted to production of ammunition carts for machine guns.10
There was a shortage of machine tools from 1940 onwards, and there were critical capacity shortages elsewhere. Capacity utilization in the steel industry reached 97% by 1941. The only way to increase production under such constraints was to use inputs more efficiently, which is what American industry repeatedly did. There were very significant gains, for example, in the construction of Liberty ships. The rate of production was limited by the number of construction berths available, so the method of construction minimized the amount of time each ship spent in its berth.
A substantial portion of ship construction was undertaken off the ways (the berths in which the keel is laid and from which the ship is eventually launched). Most yards had a linear “conveyor belt” plan. Steel plates and shapes entered a holding area in the yard on its inland side and passed through a large prefabrication area, where major sections of the ship were constructed. The sections were then transported on rails or by movable cranes to one of the ways, where large cranes lifted them onto the hull for final assembly. Welding constituted the bulk of this work. A Liberty ship contained almost 600,000 feet of welded joints, and welding labor accounted for about one-third of the direct labor employed in construction. Once the main structures were completed, the vessel was launched and moved to the outfitting docks nearby. Another keel was typically laid on the vacant way within 24 hours. At the outfitting dock, final painting, joinery, and electrical work were completed, and rigging and lifeboats were added. The same day on which final outfitting was completed, the ship was delivered to a representative of the USMC, boarded by its crew, and sent to join one of hundreds of convoys crossing the Atlantic or the Pacific.11
Prefabrication was a relatively new concept in shipbuilding, and as more ships were built, both shipbuilders and their suppliers found ways of completing the ships more quickly. Each doubling of cumulative output increased the rate of production by about 22%.12
A similar kind of “learning by doing” occurred in other projects, both big and small. One of the largest projects was the factory built by Henry Ford to produce B-24 bombers: its peak rate of production was 650 aircraft per month — “a bomber an hour.” It was initially beset with problems that drastically slowed production, but like the Liberty shipyards, the B-24 factory continually modified its methods until it got the rate of production that it wanted. Among notable smaller projects, Pontiac reduced the cost of an anti-aircraft gun by 23%, while Chrysler reduced the costs of both a radar system and a gyrocompass by more than half.13
At the end of the war, American firms had to switch from producing military goods to producing consumer goods. Despite this massive dislocation of business activity, productivity kept growing. What the firms learned about efficient production in wartime, they did not forget in peacetime.
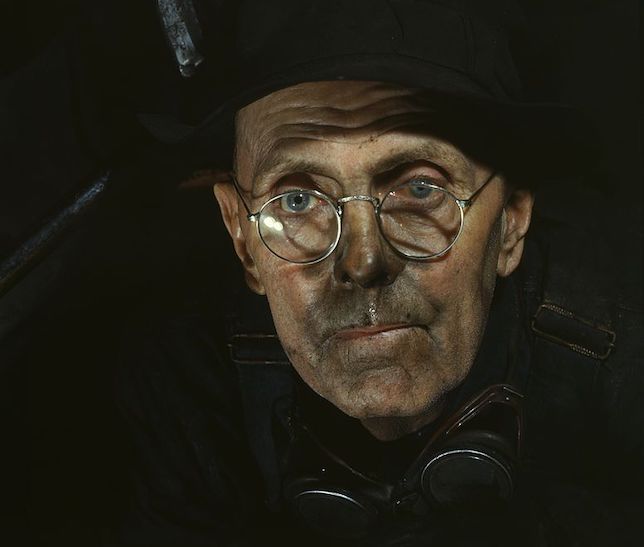
Not all of TFP growth can be attributed to organizational improvements. Investment fell during the Great Depression, but it was mostly investment in structures that declined. Investment in equipment quickly rebounded, so that firms continued to benefit from new technologies. The images below show Ford pickup trucks from 1928 and 1940, the years that bracketed the Great Depression, and give some sense of the pace of technological change during the Depression.

American entrepreneurs were still expanding the use of electricity and the internal combustion engine, even though both technologies were more than half a century old. One example was the electrification of factories. Before electrification, power had been provided by steam engines that turned a central drive shaft, and pulleys and drive belts connected the individual machines’ drive shafts to the central drive shaft. As much as a quarter of the power was lost through friction, and the layout of the factory was constrained by the limits on the design of the central drive shaft. The electrified factory solved both of these problems by powering each machine with its own electric motor. The next innovation was handheld power tools, which were especially useful in assembly lines that required workers to have some freedom of motion. The benefits of factory electrification grew over time. Steam and water turbines were increasingly being used to run the dynamos that generated the electricity. Exploiting this technology’s economies of scale drove down the price of electricity and increased the profitability of electrification.
Henry Ford had introduced the moving assembly line in 1913, but his assembly lines were not electrified until the 1920s. Gordon argues that the combination of assembly line and electric power tools “utterly transformed manufacturing.”
It is likely that electric power and the assembly line explain not just the TFP growth upsurge in the 1920s, but also that of the 1930s and 1940s.14
The evidence of this transformation lies in the power generation statistics. The amount of electric power generated by factories rose by almost 80% between 1929 and 1941, and by more than 140% between 1929 and 1950. The amount of electric power generated by utilities rose by almost 80% between 1929 and 1941, and by almost 260% between 1929 and 1950. These statistics show the increasing extent of power use. Another statistic shows the increasing intensity of its use: the ratio of electric power generation to the value of privately held equipment doubled between 1929 and 1950.
There were also large increases in the amount of horsepower generated by “prime movers.” The amount of automotive horsepower tripled between 1929 and 1950, partially as a result of a major expansion of the highway system which increased the efficiency of motor transport. The amount of horsepower used on farms rose by 150%, and the amount used in factories rose by 70%. The ratio of horsepower to the value of privately held equipment rose by 45%.15
Power, whether generated by the internal combustion engine or the dynamo, was a major factor in American TFP growth throughout the first half of the twentieth century.
Slow Total Factor Productivity Growth After 1970
A deluge of new technologies, particularly in information and communications technology, has fundamentally changed the way that industry and commerce operate. The major innovation in communications was the cellphone, which first appeared in the 1980s. Mainframe computers, used to manage data and prepare bills, appeared in the 1960s. The ATM, the barcode scanner, and automated credit card authorization are all products of the 1980s. The internet developed in the late 1990s, giving rise to e-mail and e-commerce. Industrial robots were introduced by GM in 1961 and were widely used by the 1990s.
Despite these innovations, there has been just one decade since 1970 in which output per hour and TFP grew rapidly. The post-1970 “productivity slowdown” is shown in the two figures below.


The contrast between ceaseless change in the marketplace and lethargic change in the statistics is somewhat puzzling. The first step in understanding why it has happened is to understand exactly what has happened.
TFP is a measure of economic efficiency — the effectiveness with which the economy uses factors of production — while output per hour measures what is commonly called “labour productivity” or simply “productivity.”16 An ICT innovation (like mainframe computing in the 1960s) raises labour productivity because each worker has more tools and equipment at his disposal. Gordon calls this effect “capital deepening.” The effect of capital deepening on labour productivity is the second term on the righthand side of the quasi-English equation above. If the ICT innovation raises labour productivity by about as much as other investments of the same magnitude would have, capital deepening is the only effect. However, if the ICT innovation raises labour productivity by much more than other investments would have, the extra boost is labelled “TFP growth” and recognized as technological progress. This effect is the first term on the righthand side of the quasi-English equation.
Gordon’s statistics show that capital deepening has occurred at a fairly steady pace from 1870 to the present. Replacing coal gas plants with electrical generating stations, horse-drawn wagons with trucks, mechanical calculators with computers: all of these things are capital deepening. What has varied over time is the degree to which new technologies have produced an extra boost to labour productivity that gets labelled as TFP growth. The extra boost of the post-1970 technologies was a little bigger than that of the pre-1920 technologies, but very much smaller than that of the 1920-1970 technologies.
The new technologies have had limited impact because, from a human perspective as opposed to a scientific one, they are not revolutionary. The previous century (1870-1970) had gone from horse-and-buggy to moon landing. Every aspect of material well-being had been radically altered: food, shelter, transportation, communications, entertainment, health and hygiene, longevity and infant mortality. As exciting as many of the post-1970 technologies might be, it is difficult to find one that has fundamentally changed the way that people live. The cellphone has replaced the phone booth, GPS navigation has replaced paper maps, online banking has replaced the chequebook and monthly statements, and life goes on much as it did before.

The “Everybody Knows” Argument
A common reaction to modern technology’s low productivity numbers is what Ezra Klein calls the “everybody knows” argument:
Everybody knows technological innovation is reshaping the world faster than ever before. The proof is in our pockets, which now contain a tiny device that holds something close to the sum of humanity’s knowledge, and it’s in our children, who spend all day staring at screens, and it’s in our stock market, where Apple and Google compete for the highest valuation of any company on Earth. How can anyone look at all this and doubt that we live in an age dominated by technological wonders?17
So, if the statistics show low productivity growth, they must be wrong.
The “everybody knows” argument is correct: the productivity statistics do understate technology’s impact — but they have always understated its impact. It is likely that if productivity growth were accurately measured, the gap between past and current TFP growth would be larger, not smaller.
There are two reasons why the full impact of technological change is not captured in the productivity statistics. The first relates to externalities, the unintended consequences of our choices. As an example, consider the adoption of the automobile. When the horse and buggy was the primary mode of transportation, city streets were ankle deep in horse manure. The problem of manure was reflected in the dress of the times: men wore spats to protect their shoes and socks from the filth of the streets, and women wore pattens (overshoes with soles several inches thick) to lift the hems of their skirts above the manure. People weren’t thinking about the manure in the streets when they began to drive automobiles: they chose automobiles because they were fast, did not tire, and did not need to be fed several times a day. Nevertheless, as more and more people began to use motor transport, the manure disappeared from the streets, and cities became healthier and more pleasant places to live.18 Such externalities are not reflected in the market prices of goods, and are therefore excluded from TFP.
One important kind of externality is the network externality, which occurs when more and more people adopt a common technology. The first telephones were direct connections between two places, such as an entrepreneur’s home and his place of business. The telephone had some success when used in this fashion, but it was not widely adopted until Thomas Edison’s workshop developed the switchboard, which allowed any user to be connected to any other user. With this device in place, each person’s telephone subscription made a subscription more useful to everyone else (because they had a slightly wider range of potential contacts). This externality created a “critical mass” dynamic that resulted in the telephone’s rapid adoption.19 The same dynamic has occurred with modern social media such as Facebook and Twitter.
The second reason why productivity statistics understate the benefits of technology relates to consumer surplus, the benefit that individual consumers get from trading in organized markets. Almost everything that a person buys is worth more to him than what he actually pays for it. Suppose that a man buys a shirt for $40. He might like that shirt so much that he would have been willing to pay $60 for it, but he only pays $40 because that is the price on the tag. The difference between the $60 that he is willing to pay and the $40 that he actually pays is his consumer surplus on the transaction. The consumer surplus on every transaction is positive, except for the rare cases in which the buyer is truly indifferent between buying the item and leaving it on the shelf.
A new commodity can generate very large consumer surplus for its buyers, especially if it is the first to perform some function. Sugar and tea were not widely consumed in England before 1700, but they became extremely popular during the eighteenth century. Taking tea became an important social custom, and both men and women replaced the traditional heavy breakfast with a lighter one consisting of sugared tea and either bread or pastry. Sugared tea was a matter of survival for the poorest workers:
Sugar was frequently used as a substitute for a protein source, consumed in the absence of meat when and where meat was too expensive…A cup of sugary tea could reduce feelings of hunger, and give energy for a short time. Tea could serve as a substitute for a hot meal, especially where heating fuel was in scarce supply.20
It has been estimated that by 1850, the values of these two goods to the English were so far above their market prices that the average Englishman would have been willing to give up 15% of his income to maintain his access to them.21 This estimate — 15% of income — is a measure of the consumer surplus derived from the purchase of just these two goods.
Since new technologies are valued at their market prices, not at their value to the consumers, the statistics miss a part of their true value, making the producers of these technologies appear less productive than they actually are. This problem could affect a wide range of consumer technologies, including e-mail, e-commerce, digital photography, video streaming, GPS navigation, and social media.
The mismeasurement of productivity is likely to have been more serious before 1970 than after it. The first digital cameras replaced film cameras. They were more convenient than film cameras (there was no film to be developed, and the pictures were easily edited and copied) but they performed essentially the same function. On the other hand, the first film camera — the Eastman Kodak (1888) — dramatically altered people’s perception of their lives. It replaced the bulky plate camera, and was so simple to operate that anyone could do it. For the first time, people could take pictures of their children playing at the beach, an uncle relaxing in an armchair, or whatever else caught their attention. A photographic record of daily life became possible, and people began to keep photo albums so that they could look back upon their lives. The switch from analogue audio recordings to digital recordings in the 1980s was likewise motivated by convenience, but Edison’s phonograph (1877) cannot be called anything but revolutionary: it allowed people to listen to a musical performance at a different time and place than the one at which it was performed. Both the film camera and the phonograph altered people’s lives in such fundamental ways that they would have generated much larger consumer surplus than their modern successors, the digital camera and digital music. And the larger is the surplus, the greater is the mismeasurement.

Network externalities seem to be common with modern technologies, but their importance to the quality of life is unclear. By contrast, the provision of clean running water and sewage systems in the first half of the twentieth century had enormous public health implications: infectious diseases accounted for 37% of deaths in 1900, but only 5% of deaths in 1955. The implied increase in longevity is an external effect (albeit a clearly foreseen one) of the provision of basic services. It is entirely missed by the national accounts.
The Prospects for Future Total Factor Productivity Growth
TFP growth is not a stationary process. The Second Industrial Revolution (1870-1913) marked the beginning of the now familiar interaction between science and technology. There is as much learning-by-doing in research as there is in other productive activities, so their interaction was probably not as constructive as it later became. On the other hand, there were some fundamental scientific breakthroughs during the Second Industrial Revolution, notably in the understanding of electric and magnetic fields, whose economic potential has still not been completely exploited. Neither of these events is repeatable: the exchange between science and technology will never again be in its infancy, and the fundamental principles of the physical world will not be discovered again. A “normal” rate of TFP growth cannot be inferred by looking back to this time. The consistently high TFP growth rates of 1920-1970 are an equally poor guide. They were caused by a combination of efficient organization, economies of scale, and the exploitation of nineteenth century inventions. These events, too, are not repeatable.
There is no historical norm for TFP growth. Any prediction of the future based upon the past — or even a very selective bit of the past — is of little value. The only way to estimate the prospects of TFP growth over the next two or three decades is to evaluate technologies that are already “on the horizon.” The technological optimists and technological pessimists agree on this proposition, which hasn’t stopped them from reaching opposite conclusions.
“On the horizon” is itself a tricky concept. Nuclear power plants were once expected to make electricity “too cheap to meter,” but the world’s carbon obsession notwithstanding, no-one is building them today. A bird in the hand is still worth two in the bush.
Technological Pessimism
Robert Gordon assumes that TFP growth in the near future will proceed at about the same pace as it did over the recent past — but he doesn’t entirely believe his own baseline. TFP growth has been slow since 1970, but it was based on a number of achievements that Gordon does not believe will be equalled in the near future:
[Technological optimists] are utterly unconvincing that the pace of technological change will be faster over the next 25 years than over the last 40. Consider what they are up against that has happened within the last 40 years since 1972: the mainframe era that eliminated routine clerical jobs of endlessly retyping contracts, bills, and legal briefs; the invention of the personal computer that allowed many professionals to write their papers without the aid of a secretary; the invention of game-changing technologies in the retail sector including the ATM machine, barcode scanning, self checkout, and airline automated check-in kiosks; Amazon and e-commerce; wiki and the availability of free information everywhere; the obsolescence of the hard-copy library catalogue, the auto parts catalogue, the print dictionary and encyclopaedia.
I am dubious that the nirvana of artificial intelligence, big data, robots, driverless cars, and so on will match the achievements enumerated above of the last 40 years. By basing my productivity forecast on a continuation of the 1972- 2014 pace of innovation, I am deliberately suppressing my skepticism.22
One of Gordon’s concerns is the narrowness of technological progress, which has been concentrated in entertainment, communications, and information technology. He believes that a continuation of this trend will leave large parts of the economy untouched, making high TFP growth rates difficult to achieve.
The biggest impediment to further progress might be the human user. Gordon uses word processing as an example.23 In the early days of balky programs and slow hardware, improvements in either software or hardware noticeably sped up the preparation of a document. These improvements have been cumulatively so successful that the computational part of the job now takes seconds while the human part of the job takes minutes or hours. Shaving more microseconds from the computational part of the job will have no appreciable impact on the time taken to complete the job.
The optimists would not dispute this point. They imagine a future in which technology replaces humans as much as it assists them.
Technological Optimism

The optimists have a different sense of “on the horizon” than other people do. Moore’s Law has accustomed them to thinking in terms of exponential growth, and as the figure above shows, they can find it in many aspects of computer hardware.24 They tend to think that new technologies develop in much the same way:
Improvement in autonomous vehicles reminds us of Hemingway’s quote about how a man goes broke: “Gradually and then suddenly.” And self-driving cars are not an anomaly; they’re part of a broad, fascinating pattern. Progress on some of the oldest and toughest challenges associated with computers, robots, and other digital gear was gradual for a long time. Then in the past few years it became sudden; digital gear started racing ahead, accomplishing tasks it had always been lousy at and displaying skills it was not supposed to acquire anytime soon.25
The possibility of explosive progress has led Ray Kurzweil, a Google engineer and futurist, to set 2029 as the date at which computers will become smarter than humans. For the technologically uninitiated, it is difficult to distinguish prophecy from hubris.
Artificial Intelligence
The optimists believe that future progress depends on artificial intelligence, and especially on machine learning.
Machine learning represents a fundamental change from the first wave of computerization. Historically, most computer programs were created by meticulously codifying human knowledge, mapping inputs to outputs as prescribed by the programmers. In contrast, machine-learning systems use categories of general algorithms (e.g., neural networks) to figure out relevant mappings on their own, typically by being fed very large sample data sets. By using these machine-learning methods that leverage the growth in total data and data processing resources, machines have made impressive gains in perception and cognition, two essential skills for most types of human work.26
A neural network places data into categories that the network itself has identified. Confronted with new data, it will place the data in a category, and then make predictions — “this is a cat,” or “life expectancy is 1-5 years” — based upon the category. Learning occurs through feedback loops: if the neural network’s predictions are revealed to be wrong, it revises the manner in which it categorizes data. Neural networks are often employed in areas where imaging is important. They are used in dermatology to identify melanomas, and in radiology to identify such things as wrist fractures and pneumonia. However, they have many other applications. One of them is statistical machine translation. Here, a text is translated from one language to another by searching a library of paired documents (one in each of the two languages). Word sequences from the original text are located in the documents, and the target-language equivalents are identified. The translation is completed by compiling overlapping word sequences in the target language. Google Translator operates in this manner.
Two applications of machine learning that are currently thought to have great potential are driverless cars and robots.
Driverless Cars
The first test of autonomous cars, in the Mojave Desert in March 2004, was a complete failure; but by October 2010, Google had developed autonomous cars that drove successfully on California’s road system. It was Google’s achievement that led Brynjolfsson and McAfee to suggest that progress is gradual and then sudden. But there is a third data point: Waymo One, a Google subsidiary, announced in December 2018 that it was opening its fleet of autonomous cars to the general public. The fleet is located in Phoenix, Arizona, where the last snowfall was in 1937. The roads there have been carefully curated. (Autonomous cars still do not operate on country roads, let alone in the Mojave Desert, and they do not operate in winter conditions.) There are back-up drivers in the cars, and the frequency with which the human drivers intervene is both too high and (at least for now) not perceptibly declining.27
Progress in driverless cars was gradual, then sudden, and is now gradual again. Industry representatives recognize that significant obstacles remain:
“Everyone in the industry is becoming more and more nervous that they will waste billions of dollars,” said Klaus Froehlich, a board member at BMW and its head of research and development.
GM President Dan Ammann calls developing an automated vehicle that can navigate city streets more safely than a human driver “the engineering challenge of our generation,” and a project that will ultimately take years and billions of dollars to fully develop.
“Right now we are in a race to the starting line,” he said in an interview with Reuters.28
But, supposing that the technological obstacles are overcome, how large would the productivity gains be? The significant gains would come from the elimination of drivers in the taxi and trucking industries; these drivers could then be redeployed to other parts of the economy. An optimistic assessment is that the number of professional drivers in the United States could be reduced from 3.5 million to about 1.5 million, which would raise productivity by about 1.7%. This gain would be spread over a fairly long phase-in period, perhaps ten years.
Robots
Robots have been widely used in industry for decades, but they have almost always been used for rigidly defined tasks. Their traditional advantage is that they can perform an assigned task exactly and repeatedly. Their disadvantage is that they are not flexible, and shifting from one task to another requires extensive reprogramming.
The original robots were essentially automatons, but they are increasingly being endowed with artificial intelligence that allows them to make complex decisions. Their wider use has been held back by what is known as Moravec’s paradox: the computational requirements of high-level reasoning are small, but the computational requirements of even basic sensorimotor skills are enormous. A robot could beat you at chess — if only it could move the pieces. Brynjolfsson and McAfee argue that progress is now being made on the sensorimotor problem, but perceptive and mobile robots are still “over the horizon” even for many optimists.
Technological Progress and the Distribution of Income
Peter Thiel has said, “We wanted flying cars; we got 140 characters.” This witticism neatly captures a widespread discontent with modern technologies, but it is the “we” that catches my attention. I suspect that a survey of Americans would show that their concerns include housing, education, health care, job security, hours of work, their children’s futures. Flying cars would not make the list. The failure of modern technology is not that it has been unable to produce flying cars, but that it has not produced enough of the things that Americans genuinely want. Economic growth, in the sense of a general rise in the standard of living of the majority of the people, appears to be shutting down.
The position of lower-income Americans began to change around 1970, which was also the beginning of the productivity slowdown. Since that time, the share of income earned by Americans in the bottom half of the income distribution has fallen by about nine percentage points, and the share earned by Americans in the top 1% of the distribution has risen by nine percentage points. The timing is not coincidental. Computerization has destroyed many of the jobs traditionally held by lower-income Americans and opened others to global competition. It has also created “winner-take-all” tournaments among entrepreneurs, making the fortunate few fabulously wealthy.

In some ways the modern history of technology reflects what Leijonhufvud called “effective demand” — wants backed by hard cash. New technology before 1970 was embodied in material goods such as cars, airplanes, sewer systems, radios, and Hollywood movies. The production of these goods required a great deal of labour and a wide variety of skills, so Americans generally earned good incomes. Their purchasing power gave them some influence over the course of technology. As Adam Smith put it,
It is not from the benevolence of the butcher, the brewer, or the baker, that we can expect our dinner, but from their regard to their own interest.
Technology was developed by people who, like the butcher and the baker, looked after their own interests. Henry Ford developed the assembly line so that his cars would be cheap enough to be purchased by any gainfully employed person. Thomas Edison was a hard-headed businessman who chose projects for their profit potential: the lightbulb, the phonograph, the movie camera. The shift of income away from lower-income Americans since 1970 means that they have less influence on the course of technology. They use many modern technologies — Facebook, Twitter, Google — essentially by default.
Edward Glaeser has recognized that people are affected by technology as both producers and consumers, but seems remarkably comfortable with recent developments.
It is hard to think of any innovations before the modern age that increased demand for the most skilled workers while providing consumer benefits for the masses. Indeed, for such a thing to occur, one must imagine a world in which highly paid elite workers toil for the benefit of services that will be used by the poor. Could such a thing be imaginable in pre-revolutionary France or in Ming China? Yet that is exactly what happens at Google or Facebook. Highly paid workers work constantly to improve a service that is provided freely to hundreds of millions of poorer users.
This inversion of the traditional nature of innovations represents the rise of superstar-like technologies that enable the highly competent to provide their services as almost a public good, with no congestion in use. The most natural precursor to this modern inversion was well-paid artists, such as writers and movie stars, who entertained the masses. The inversion also happened when Fred Astaire and Ginger Rogers danced for depression-era movie audiences.29
The comparison to Hollywood’s “golden age” seems to me to be misguided. The Hollywood studios were no different from Smith’s butcher and baker. Large numbers of people were willing to pay cash to watch Fred and Ginger dance, and this willingness induced the studios to make more Fred-and-Ginger movies. Google and Facebook, on the other hand, provide free services because they are able to turn their users into little profit centers. Their self-interest lies with the advertisers, not with the users. It lies with the top 1%, not the bottom 50%.
It is almost certain that the technologies of the near future will further skew the American income distribution. Can technology develop for the general good if a large part of the population is starved of purchasing power? I am reminded of Josiah Tucker: “You wish to keep a shop, but hope to have only beggars for customers.”
- The standard of living is not completely determined by per capita output because the allocation of output also matters. A large part of output is allocated by governments, for better or for worse. The standard of living rises if a government provides useful goods and services, such as bridges, harbours, highways, sewage systems, education and health care. However, governments often have interests that differ from those of its citizens. The Soviet Union after WW II is an obvious example. It was able to bring about large increases in per capita output, but much of the additional output went to the military and to state-owned industries. For the Soviet people themselves, the pay-off of a better standard of living never came. ↩
- These figures come from Robert Warples’ post Hours of Work in U.S. History. His source for the nineteenth century number is the Weeks Report, prepared as part of the census of 1880. His source for the twentieth century numbers is Ethel Jones, “New Estimates of Hours of Work per Week and Hourly Earnings,1900-1957,” Review of Economics and Statistics (1963). ↩
- This statement might appear to contradict Acemoglu and Robinson’s claim that poor institutions — extractive institutions, in their terminology — inhibit growth, but it does not. Acemoglu and Robinson’s main argument is that extractive institutions either hold back technological progress, and that slow technological progress leads to slow TFP growth. See here for a more detailed discussion. ↩
- First write the production function in logarithmic form. Then, recognizing that
, differentiate it with respect to
- It is Figure 1.2 from Gordon, The Rise and Fall of American Growth. ↩
- It is Figure 16.5 from Gordon, The Rise and Fall of American Growth. ↩
- Although he is best known for the Bunsen burner, a fixture of every high school chemistry lab, Robert Bunsen had a very distinguished career. He developed an antidote for arsenic poisoning (arsenic had a number of commercial uses at the time, including wallpaper), and used electrolysis to produce pure metals such as chromium and lithium. Bunsen and Gustav Kirchhoff, a German physicist, developed the first spectroscope. ↩
- Paul Krugman, “Paul Krugman Reviews ‘The Rise and Fall of American Growth’ by Robert J. Gordon,” New York Times (2016). ↩
- Robert Gordon, The Rise and Fall of American Growth, p. 560. ↩
- Robert Gordon, The Rise and Fall of American Growth, p. 550. ↩
- Peter Thompson, “How Much Did the Liberty Shipbuilders Learn? New Evidence for an Old Case Study,” Journal of Political Economy (2001), pp. 105-6. ↩
- Peter Thompson, “How Much Did the Liberty Shipbuilders Learn? New Evidence for an Old Case Study,” Journal of Political Economy (2001), pp. 105. ↩
- Robert Gordon, The Rise and Fall of American Growth, pp. 549-50. ↩
- Robert Gordon, The Rise and Fall of American Growth, p. 557. ↩
- All of these statistics are from Gordon’s Table 16-2. ↩
- The distinction between total factor productivity and labour productivity is critical here, so I will always distinguish between the two. The bare term “productivity” often appears in the news media, where it almost always means labour productivity. ↩
- Ezra Klein, “Technology is Changing how We Live, but It Needs to Change how We Work.” ↩
- Spats and pattens survived into the 1920s, but only as fashionable accessories without any practical use. Spats rapidly disappeared after 1926, when George V boldly appeared in public without them. ↩
- Each person will subscribe if the telephone is sufficiently useful to him. The decision of some people to subscribe makes the telephone more useful to everyone, inducing more people to subscribe. Their decision to subscribe makes the telephone still more useful, inducing more people to subscribe, and so on. ↩
- Jonathan Hersh and Hans-Joachim Voth, “Sweet Diversity: Colonial Goods and the Rise of European Living Standards after 1492,” p. 9. ↩
- Jonathan Hersh and Hans-Joachim Voth, “Sweet Diversity: Colonial Goods and the Rise of European Living Standards after 1492,” ↩
- Robert Gordon, “The Turtle’s Progress: Secular Stagnation Meets the Headwinds,” in Coen Teulings and Richard Baldwin, eds., Secular Stagnation: Facts, Causes and Cures (CEPR Press, 2014), p. 54.
- Robert Gordon, “Does the “New Economy” Measure up to the Great Inventions of the Past?” (2000), p. 28. ↩
- The figure is Figure 3.3 from Erik Brynjolfsson and Andrew McAfee, The Second Machine Age (W. W. Norton, 2014). The figure is log-linear, so the growth rate is proportional to the slope of the line. A more-or-less straight line implies a fairly constant rate of growth. ↩
- Erik Brynjolfsson and Andrew McAfee, The Second Machine Age (W. W. Norton, 2014), p. 20. ↩
- Erik Brynjolfsson, Daniel Rock and Chad Syverson, “Artificial Intelligence and the Modern Productivity Paradox: A Clash of Expectations and Statistics,” p. 2. ↩
- See Filip Piękniewski’s post “Autonomous Vehicle Safety Myths And Facts, 2018 Update” for more information. Piękniewski writes, “It is hard to support the claim that AV’s are much safer than humans. Now as I’ve mentioned, the relationship between crashes and disengagements is not clear, but there is roughly 2 orders of magnitude gap – this is a HUGE gap! Even if we assume that 1 in 10 disengagements…would have caused a crash (which I think is very optimistic), there is still 10x factor. The human data averages over all vehicles (average car in the US is 11.2 years old, things look better for newer vehicles with more safety features), all weather conditions (good fraction of accidents happen in bad weather), includes fair number of DUI cases. If we were to exclude some of these factors, human data becomes much better.” ↩
- Reuters News Agency, “GM’s Driverless Car Bet Faces Long Road Ahead,” 24 October 2018. ↩
- Edward Glaeser, “Secular Joblessness,” in Coen Teulings and Richard Baldwin, eds., Secular Stagnation: Facts, Causes and Cures (CEPR Press, 2014), pp. 72-3.
